


I SHARES MSCI CHINA INDEX ETF (ECNS)NYSE
Report No. 2449 Analysis by: Harry Aloof FEBRUARY 19, 2013
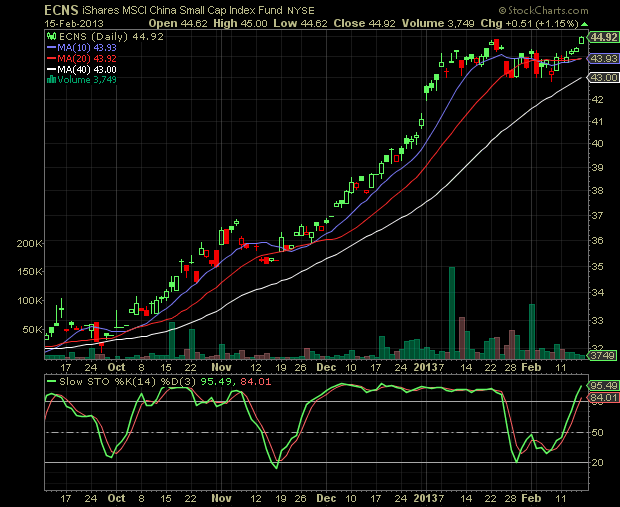
Technical Viewpoint: From a low of $43.00 on Jan 28, 2013 prices rallied,
reaching a high of $44.35 on Feb 1, 2013. A decline saw prices pull back,
reaching a low of $42.82 on Feb 7, 2013. Another rally saw prices
penetrate resistance line "A", closing yesterday at $44.92. Technicals:
Stochastic Oscillator (STOC): A Buy Alert! was given on Feb 11, 2013
when the solid line crossed the dotted line to the upside. Support:
Remains at $43.72. Resistance: Is at $47.00. Point & Figure: Reversed
to the upside on Feb 15, 2013. A P&F downside reversal takes place at
$43.00. Summary: Technical indicators have turned bullish. BUY! I SHARES MSCI CHINA INDEX ETF (ECNS-NYSE) @ $45.13 Stop: Use
a protective stop of $43.13.
I SHARES MSCI CHINA INDEX ETF is
currently trading @ $44.92 plus $0.51 on Feb 15, 2013. Price
Objective: $59.50. Risk/Reward: $2.00 VS. $14.38. Today's Risk
Reward Ratio: 7:1
Three Part Technical Chart
Daily Candle Stick Chart Point & Figure Chart Technical Study
Price Objective: $59.50
Risk/Reward: $2.00 VS. $14.38
Risk/Reward Ratio: 7:1