BitCoinHarry's "Pic of the Day" Is now being offered FREE! to New Members. "No Credit Card Necessary" Join us now and receive today's latest Crypto Recommendation.

Subscribe Now

TODAY'S PICK
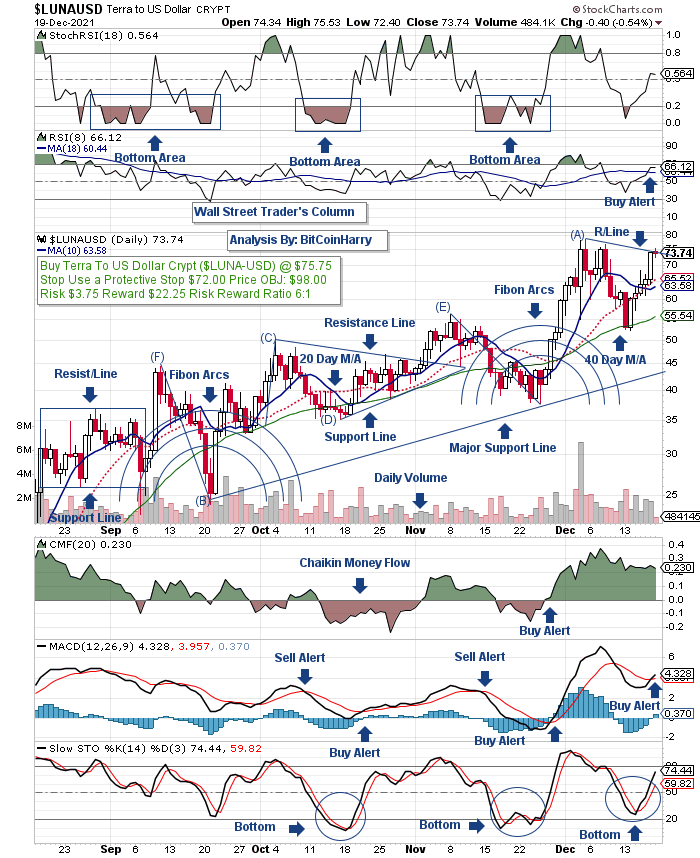
LUNA ($LUNA-USD-NYSE): Technical
Viewpoint: From a low of $15.00 on Dec 28, 2021
prices rallied, reaching a high of $20.00 on Dec 28, 2021.
A decline saw prices pull back, reaching a low of $00.00 on Dec 28, 2021. Another rally saw prices penetrate resistance
line "A", closing yesterday at $00.00. Technicals:
RSI Index (RSI): A Buy Alert! was given on Dec 27, 2021 when the solid line crossed the dotted line to the upside. Support: Remains at $0. Resistance:
Is at None at current levels. Point & Figure: Reversed to the
upside on Dec 27, 2021. A P&F downside reversal
takes place at $15.00. Summary: Technical indicators have
turned bullish. BUY! Luna ($LUNA-USD-NYSE) @ $35.00 Stop:
Use a protective stop of $14.00. Luna
is currently trading @ $00.00 plus $00.00 on Dec 27, 2021.
Price Objective: $00.00. Risk/Reward: $00.00
VS. $00.00. Today's Risk Reward Ratio: 4:1
Three Part Technical Chart
Daily Candle Stick Chart Point & Figure Chart Technical Study
Weekly PICK
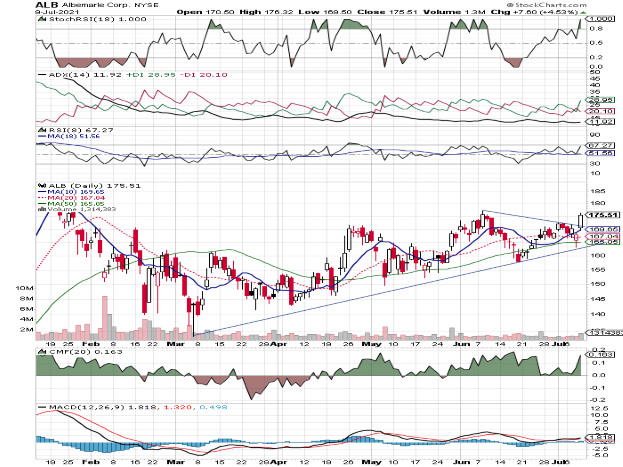
ALBEMARLE CORP (ALB-NYSE): Technical
Viewpoint: From a low of $149.66 on May 6, 2021
prices rallied, reaching a high of $177.18 on Jun 8, 2021.
A decline saw prices pull back, reaching a low of $158.82 on Jun 18, 2021. Another rally saw prices penetrate resistance
line "A", closing yesterday at $175.51. Technicals:
MACD Index (MACD): A Buy Alert! was given on Jul 7, 2021 when the solid line crossed the dotted line to the upside. Support: Remains at $163.00. Resistance:
Is at $177.18. Point & Figure: Reversed to the
upside on Jun 24, 2021. A P&F downside reversal
takes place at $162.00. Summary: Technical indicators have
turned bullish. BUY! Albemarle Corp (ALB-NYSE) @ $176.50 Stop:
Use a protective stop of $169.50. Albemarle Corp
is currently trading @ $175.51 plus $1.15 on Jul 8, 2021.
Price Objective: $201.00. Risk/Reward: $7.00
VS. $24.50. Weekly Risk Reward Ratio: 3:1

Three Part Technical Chart
Weekly Candle Stick Chart Point & Figure Chart Technical