|
INT'L BUSINESS MACHINES
(IBM-NYSE):
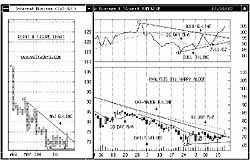
Technical Viewpoint: From a low
of $66.10 on Jun 26, 2002 prices
rallied, reaching a
high of $73.90
on Jul 5, 2002. A
decline saw prices pull back, reaching a
low of
$66.60 on Jul 15, 2002.
Another rally saw prices penetrate
resistance, closing 7/18/02
at $72.05. Technicals: Momentum Index (MTM): A Buy Alert!
was given on Jul 11, 2002 when the solid line crossed the dotted line to the upside.
Support: Remains at $67.25. Resistance: Is at $77.75.
Point & Figure: Reversed to the upside on Jul 16, 2002. A P&F upside
reversal takes place at $71.00. Summary: Technical indicators have turned bullish. BUY! Int'l Business Machines
(IBM-NYSE) @ $74.25 Stop: Use a protective stop of $71.50.
Int'l Business Machines is currently trading @ $72.05 plus $1.36 on Jul 18, 2002. Price Objective:
$97.00. Risk/Reward: $2.75 VS. $22.75. Today's Risk Reward Ratio: 8:1
|
Three Part
Technical Chart
Daily Candle Stick Chart
Point & Figure Chart
Technical Study
View full size chart
Price Objective:
$97.00
Risk/Reward:
$2.75 VS. $22.75
Risk/Reward Ratio:
8:1
|
