|
AFFYMETRIX INC
(AFFX-Nasdaq):
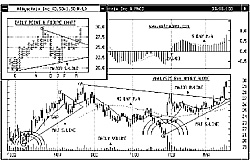
Technical Viewpoint: From a low
of $21.13 on Jan 29, 2003 prices
rallied, reaching a
high of $27.75
on Jan 31, 2003. A
decline saw prices pull back, reaching a
low of
$24.05 on Feb 25, 2003.
Another rally saw prices penetrate
resistance, closing 3/18/03
at $29.75. Technicals: MACD-Histogram (MACD-H): A Buy Alert!
was given on Feb 3, 2003 when the Histogram crossed the "0" line to the upside.
Support: Remains at $26.75. Resistance: Is at $31.00.
Point & Figure: Reversed to the upside on Mar 14, 2003. A P&F upside
reversal takes place at $28.00. Summary: Technical indicators have turned bullish. BUY! AFFYMETRIX INC
(AFFX-Nasdaq) @ $30.13 Stop: Use a protective stop of $28.13.
AFFYMETRIX INC is currently trading @ $29.75 plus $0.84 on Mar 18, 2003. Price Objective:
$39.50. Risk/Reward: $2.00 VS. $9.38. Today's Risk Reward Ratio: 4:1
|
Three Part
Technical Chart
Daily Candle Stick Chart
Point & Figure Chart
Technical Study
View full size chart
Price Objective:
$39.50
Risk/Reward:
$2.00 VS. $9.38
Risk/Reward Ratio:
4:1
|
