|
VARIAN INC
(VARI-Nasdaq):
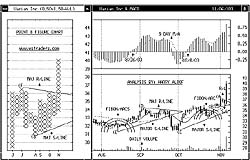
Technical Viewpoint: From a high
of $31.25 on Sep 30, 2003 prices
declined, reaching a
low of $35.93
on Oct 13, 2003. A
rally saw prices pull back, reaching a
high of
$33.50 on Oct 23, 2003.
Another decline saw prices penetrate
support, closing 11/6/03
at $39.83. Technicals: MACD-Histogram (MACD-H): A Sell Alert!
was given on Oct 8, 2003 when the Histogram crossed the "0" line to the upside.
Support: Remains at $36.00. Resistance: Is at None at current levels.
Point & Figure: Reversed to the downside on Nov 6, 2003. A P&F downside
reversal takes place at $38.50. Summary: Technical indicators have turned bearish. SELL! Varian Inc
(VARI-Nasdaq) @ $40.50 Stop: Use a protective stop of $38.50.
Varian Inc is currently trading @ $39.83 minus $3.44 on Nov 6, 2003. Price Objective:
$54.00. Risk/Reward: $2.00 VS. $13.50. Today's Risk Reward Ratio: 7:1
|
Three Part
Technical Chart
Daily Candle Stick Chart
Point & Figure Chart
Technical Study
View full size chart
Price Objective:
$54.00
Risk/Reward:
$2.00 VS. $13.50
Risk/Reward Ratio:
7:1
|
