|
ELI LILLY & COMPANY
(LLY-NYSE):
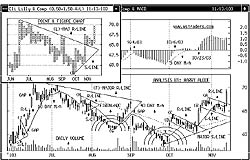
Technical Viewpoint: From a low
of $60.34 on Oct 22, 2003 prices
rallied, reaching a
high of $67.90
on Oct 30, 2003. A
decline saw prices pull back, reaching a
low of
$64.54 on Nov 12, 2003.
Another rally saw prices penetrate
resistance, closing 11/13/03
at $69.05. Technicals: MACD-Histogram (MACD-H): A Buy Alert!
was given on Oct 23, 2003 when the Histogram crossed the "0" line to the upside.
Support: Remains at $65.00. Resistance: Is at $70.44.
Point & Figure: Reversed to the upside on Nov 13, 2003. A P&F upside
reversal takes place at $68.00. Summary: Technical indicators have turned bullish. BUY! ELI LILLY & COMPANY
(LLY-NYSE) @ $69.63 Stop: Use a protective stop of $67.13.
ELI LILLY & COMPANY is currently trading @ $69.05 plus $2.86 on Nov 13, 2003. Price Objective:
$89.00. Risk/Reward: $2.50 VS. $19.38. Today's Risk Reward Ratio: 8:1
|
Three Part
Technical Chart
Daily Candle Stick Chart
Point & Figure Chart
Technical Study
View full size chart
Price Objective:
$89.00
Risk/Reward:
$2.50 VS. $19.38
Risk/Reward Ratio:
8:1
|
