|
GOOGLE
(Goog-Nasdaq):
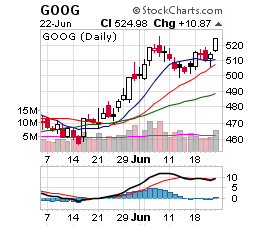
Technical Viewpoint: From a low
of $457.41 on May 15, 2007 prices
rallied, reaching a
high of $526.50
on Jun 7, 2007. A
decline saw prices pull back, reaching a
low of
$498.69 on Jun 13, 2007.
Another rally saw prices penetrate
resistance, closing 6/22/07
at $524.98. Technicals: MACD Index (MACD): A Buy Alert!
was given on Jun 22, 2007 when the solid line crossed the dotted line to the upside.
Support: Remains at $500.00. Resistance: Is at $526.50.
Point & Figure: Reversed to the upside on Jun 18, 2007. A P&F upside
reversal takes place at $505.00. Summary: Technical indicators have turned bullish. BUY! Google
(Goog-Nasdaq) @ $525.13 Stop: Use a protective stop of $510.00.
Google is currently trading @ $524.98 plus $10.87 on Jun 22, 2007. Price Objective:
$598.50. Risk/Reward: $15.00 VS. $73.37. Today's Risk Reward Ratio: 5:1
|
Three Part
Technical Chart
Daily Candle Stick Chart
Point & Figure Chart
Technical Study
View full size chart
Price Objective:
$598.50
Risk/Reward:
$15.00 VS. $73.37
Risk/Reward Ratio:
5:1
|
