|
BIDU INC
(BIDU-Nasdaq):
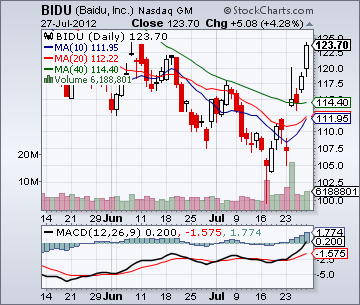
Technical Viewpoint: From a low
of $107.50 on Jun 28, 2012 prices
rallied, reaching a
high of $117.85
on Jul 5, 2012. A
decline saw prices pull back, reaching a
low of
$99.71 on Jul 17, 2012.
Another rally saw prices penetrate
resistance, closing 7/27/12
at $123.70. Technicals: MACD Index (MACD): A Buy Alert!
was given on Jul 23, 2012 when the solid line crossed the dotted line to the upside.
Support: Remains at $116.00. Resistance: Is at $124.80.
Point & Figure: Reversed to the upside on Jul 18, 2012. A P&F upside
reversal takes place at $121.00. Summary: Technical indicators have turned bullish. BUY! BIDU INC
(BIDU-Nasdaq) @ $124.25 Stop: Use a protective stop of $121.25.
BIDU INC is currently trading @ $123.70 plus $5.08 on Jul 29, 2012. Price Objective:
$149.50. Risk/Reward: $3.00 VS. $25.25. Today's Risk Reward Ratio: 8:1
|
Three Part
Technical Chart
Daily Candle Stick Chart
Point & Figure Chart
Technical Study
View full size chart
Price Objective:
$149.50
Risk/Reward:
$3.00 VS. $25.25
Risk/Reward Ratio:
8:1
|
