|
AOL TIME WARNER
(AOL-NYSE):
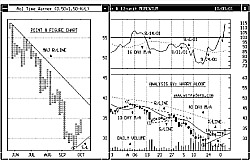
Technical Viewpoint: From a low
of $38.05 on Aug 15, 2001 prices
rallied, reaching a
high of $42.09
on Aug 27, 2001. A
decline saw prices pull back, reaching a
low of
$27.40 on Sep 25, 2001.
Another rally saw prices penetrate
resistance, closing 10/3/01
at $34.31. Technicals: Momentum Index (MTM): A Buy Alert!
was given on Sep 24, 2001 when the solid line crossed the dotted line to the upside.
Support: Remains at $32.50. Resistance: Is at $41.50.
Point & Figure: Reversed to the upside on Sep 28, 2001. A P&F upside
reversal takes place at $33.00. Summary: Technical indicators have turned bullish. BUY! AOL TIME WARNER
(AOL-NYSE) @ $34.88 Stop: Use a protective stop of $32.25.
AOL TIME WARNER is currently trading @ $34.31 plus $1.45 on Oct 3, 2001. Price Objective:
$45.50. Risk/Reward: $2.63 VS. $10.63. Today's Risk Reward Ratio: 4:1
|
Three Part
Technical Chart
Daily Candle Stick Chart
Point & Figure Chart
Technical Study
View full size chart
Price Objective:
$45.50
Risk/Reward:
$2.63 VS. $10.63
Risk/Reward Ratio:
4:1
|
