|
IHS INC
(IHS-NYSE):
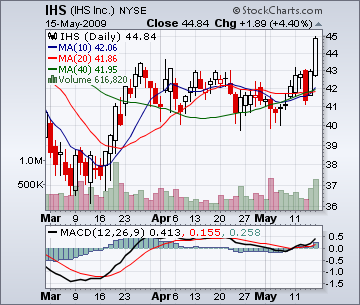
Technical Viewpoint: From a low
of $36.15 on Mar 12, 2009 prices
rallied, reaching a
high of $43.66
on Apr 24, 2009. A
decline saw prices pull back, reaching a
low of
$43.66 on May 18, 2009.
Another rally saw prices penetrate
resistance, closing 5/15/09
at $44.84. Technicals: MACD Index (MACD): A Buy Alert!
was given on May 12, 2009 when the solid line crossed the dotted line to the upside.
Support: Remains at $41.00. Resistance: Is at $43.13.
Point & Figure: Reversed to the upside on May 8, 2009. A P&F upside
reversal takes place at $43.00. Summary: Technical indicators have turned bullish. BUY! IHS INC
(IHS-NYSE) @ $45.13 Stop: Use a protective stop of $43.13.
IHS INC is currently trading @ $44.84 plus $1.89 on May 15, 2009. Price Objective:
$55.00. Risk/Reward: $2.00 VS. $9.87. Today's Risk Reward Ratio: 5:1
|
Click here to view full size chart
|
