|
BAIDU INC
(BIDU-Nasdaq):
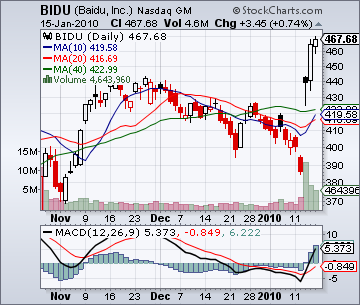
Technical Viewpoint: From a low
of $394.56 on Dec 22, 2009 prices
rallied, reaching a
high of $426.75
on Dec 29, 2009. A
decline saw prices pull back, reaching a
low of
$384.66 on Jan 12, 2010.
Another rally saw prices penetrate
resistance, closing 1/15/10
at $467.68. Technicals: MACD Index (MACD): A Buy Alert!
was given on Jan 15, 2010 when the solid line crossed the dotted line to the upside.
Support: Remains at $458.58. Resistance: Is at None at current levels.
Point & Figure: Reversed to the upside on Jan 13, 2010. A P&F upside
reversal takes place at $464.00. Summary: Technical indicators have turned bullish. BUY! BAIDU INC
(BIDU-Nasdaq) @ $470.38 Stop: Use a protective stop of $464.38.
BAIDU INC is currently trading @ $467.68 plus $3.45 on Jan 15, 2010. Price Objective:
$550.00. Risk/Reward: $6.00 VS. $79.62. Today's Risk Reward Ratio: 13:1
|
Click here to view full size chart
|
