TODAY'S PICK
LUNA ($LUNA-USD-NYSE): Technical
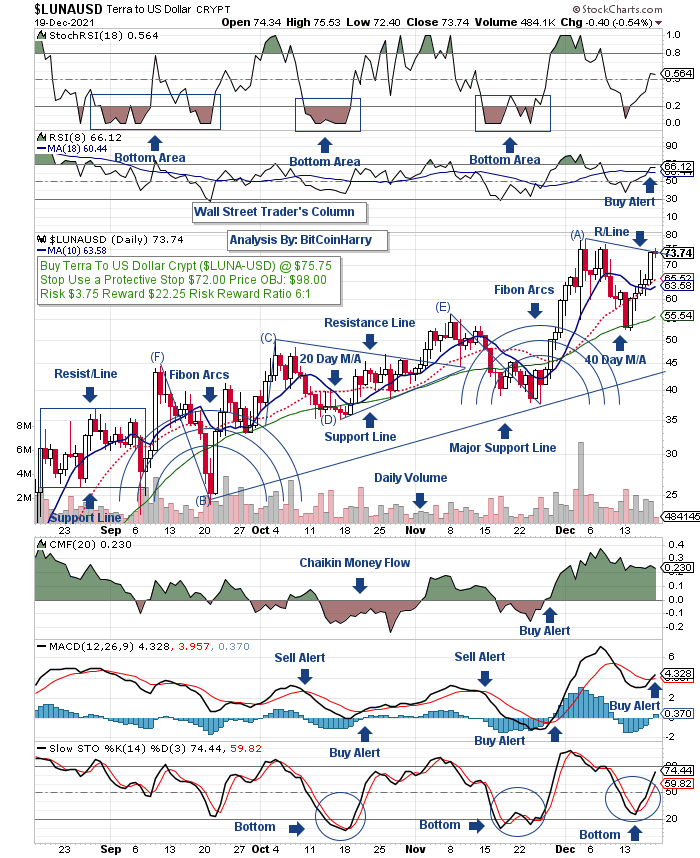
Viewpoint: From a low of $15.00 on Dec 28, 2021
prices rallied, reaching a high of $20.00 on Dec 28, 2021.
A decline saw prices pull back, reaching a low of $00.00 on Dec 28, 2021. Another rally saw prices penetrate resistance
line "A", closing yesterday at $00.00. Technicals:
RSI Index (RSI): A Buy Alert! was given on Dec 27, 2021 when the solid line crossed the dotted line to the upside. Support: Remains at $0. Resistance:
Is at None at current levels. Point & Figure: Reversed to the
upside on Dec 27, 2021. A P&F downside reversal
takes place at $15.00. Summary: Technical indicators have
turned bullish. BUY! Luna ($LUNA-USD-NYSE) @ $35.00 Stop:
Use a protective stop of $14.00. Luna
is currently trading @ $00.00 plus $00.00 on Dec 27, 2021.
Price Objective: $00.00. Risk/Reward: $00.00
VS. $00.00. Today's Risk Reward Ratio: 4:1

Three Part Technical Chart
Daily Candle Stick Chart Point & Figure Chart Technical